|
|
|
Introduction Scanning
Force Microscopy (SFM) Scanning
Force Microscopy (SFM) |
|
 |
|
 |
The scanning force microscopy (SFM),
also known as atomic force microscopy (AFM),
belongs to the branch of scanning probe microscopy
(SPM), which comprises all microscopy techniques that form pictures
of surfaces not by optical or electron-optical imaging, but due to interaction
of a physical probe with the sample.
The precursor to the SFM, the scanning tunneling microscope (STM), was
developed by Gerd Binnig and Heinrich Rohrer in the early 1980s [1,
2]
und earned them the Nobel
Prize for Physics in 1986. The first SFM was invented by Binnig, Quate
and Gerber in 1986 [3]. Its alternative name, AFM,
refers to the interactions between probe and sample on the atomic level.
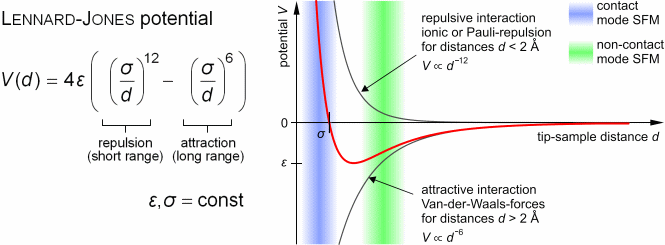
The attractive van-der-Waals forces and the Pauli repulsion due to overlapping
electron orbitals can be described by the Lennard-Jones-potential.
 |
| (Figure by Steve Pawlizak, 2009.) |
|
 |
|
|
|
(Figure taken from diploma thesis of Claudia
Brunner, 2004.) |
|
|
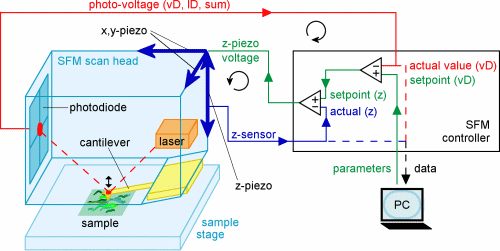
The SFM scans surfaces line by line and assembles topographical images.
A laser beams onto a cantilever and reflects from it onto a set of position
sensitive photodiodes. While the sharp tip of the cantilever moves over
the sample, the cantilever itself bends in consistency with the surface
and the photodiodes register the resulting position changes of the laser
reflection. Two piezos (a piezoelectric element expands or contracts in
direct proportion to an applied electric field) generate the scanning movement
of cantilever, laser and photodiodes in x- and y-direction. The signal
from the photodiodes goes to a z-piezo, that moves the cantilever up or
down to compensate the cantilever deflection. The information of the deflection
is used to assemble an image.
Since an SFM can image and probe samples in both dry and liquid environments,
it is possible to work with living cells under physiological conditions
[4, 5]. For our research, we are
using the NanoWizard BioAFM
(JPK Instruments AG, Berlin), where the x-y-z-scanner is attached to the
cantilever mount (see figure). The NanoWizard has the great advantage of
using a variety of light microscopy techniques (e.g. phase contrast) together
with the SFM-technique, which is especially helpful for biological research.
Imaging Modes
  imaged in Contact Mode") 
An SFM image scan visualizes the topography of the surface and can
be used to create a three dimensional representation.
There are different imaging modes for SFM, primarily distinguished
into static mode (contact mode) and dynamic modes (non-contact and intermittent
contact mode) with oscillating probe. The two most commonly used modes
for imaging biological samples are the contact and the intermittent contact
mode (tapping mode). While in contact mode the tip scratches the surface
of the sample, the cantilever in intermittent contact mode vibrates and
thus taps point after point of the sample.
Force Spectroscopy
|
 |
|
|
|
(Figure taken from diploma thesis of Steve
Pawlizak, 2009.) |
|
|
Besides imaging, there is another important application of SFM. That is
force spectroscopy. In this mode, the cantilever is pushed into the sample
at a certain point and subsequently retracted. During this process the
height information of the z-piezo element and the vertical deflection of
the cantilever detected by the four-quadrant photodiode are recorded. The
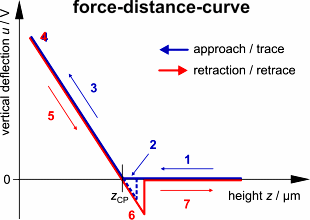
result is a so-called force-distance-curve (since the deflection is closely
related to the force that the tip applies to the sample). To be more precise,
each scan produces two curves, one showing the cantilever deflection u
in dependence on the height z while approaching the sample (trace
curve) and another one for the retraction (retrace curve). On a quasi-infinitely
hard substrate (e.g. glass coverslip), a characteristic graph is produced,
which is discussed in the following.
Trace: First the cantilever is
moved down without touching the sample, i.e. no deflection but a declining
distance is measured (1). Very close to the surface the cantilever can
be suddenly attracted by the sample due to adhesion forces (e.g. electrostatic
interaction), i.e. the cantilever flicks down the remaining distance and
gives a small downward deflection (2). When the cantilever is moved further
down, the cantilever is bent upwards in direct proportion to the z-piezo
height (3). This characteristic linear slope can be used for calibration
of the cantilever.
Retrace: As soon as a defined setpoint
of deflection is reached (4), the cantilever is withdrawn. The cantilever
gets more and more unbent, while moving upwards again (5). Then, the tip
usually keeps attracted to the surface by adhesion, which causes the cantilever
to bend in the opposite direction, until it suddenly loses contact and
flicks up into its initial position (6). Further retraction results no
longer in a vertical deflection (7).
When the cantilever is calibrated, i.e. its sensitivity s and
spring constant k are know, it is possible to calculate the applied
force F which is proportional to the vertical cantilever deflection
u.

Measurement of Elastic and Viscoelastic Properties
|
 |
|
|
|
(Figure by Claudia Brunner and Steve Pawlizak, 2004,
2009.) |
|
|
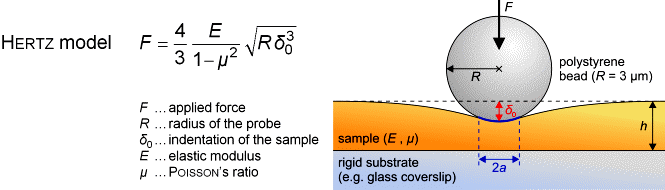
SFM may be used to measure local elastic and viscoelastic properies of
soft matter samples like biological cells. The local elastic modulus
E
can be determined by recording and analyzing force-distance-curves. In
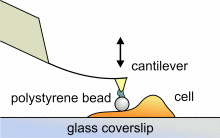
order to avoid damages of living cells during the measurement and to have
well-defined probe geometry for the following calculation of the moduli,
we modify commercially available cantilevers by gluing a small polysterene
bead (diameter ~ 6 µm) onto the tip. The appropriate calculations
are done based on the Hertz model [6].
Dynamic SFM measurements with a vibrating cantilever can be performed
to quantify even the viscous properties of the sample by determining its
storage and loss modulus. In this case a modified Hertz model is used for
data analysis as described in [7].
When thinner samples are to be probed, the influence of the underlying
hard substrate on the elasticity measurement cannot be neglected anymore
and we apply Tu and Chen corrections to the Hertz model [8].
 |
|
| (Figure by Steve Pawlizak, 2009.) |
| |
SFM can be used to measure cell-cell and cell-substrate adhesion forces
by pulling on adhered cells with a functionalized cantilever. In our lab,
we are using the CellHesion
200 (JPK Instruments AG, Berlin) for cell adhesion measurements.
A reduced adhesive strength is found in cancer cells which may be correlated
with their potential to metastasize. We will investigate the adhesion of
normal fibroblasts as well as fibroblasts throughout the progression of
malignant transformation. Precise measurements of the changes in adhesive
strength of malignant cells and of the correlated cytoskeletal properties
will provide new insight into the role of cell adhesion in cancer metastasis.
(This article was written 2003-2007, 2009 by Jens
Gerdelmann,
Claudia
Brunner &
Steve
Pawlizak.)
References:
|
|
|
G. Binnig, H. Rohrer, C. Gerber, E. Weibel:Tunneling
through a Controllable Vacuum Gap, Appl. Phys. Lett. 40(2):178-180
(1982). |
|
|
|
|
|
|
G. Binnig, H. Rohrer, C. Gerber, E. Weibel: Surface
Studies by Scanning Tunneling Microscopy, Phys. Rev. Lett. 49(1):57-61
(1982). |
|
|
|
|
|
|
G. Binnig, C. F. Quate, C. Gerber: Atomic
Force Microscope, Phys. Rev. Lett. 56(9):930-933 (1986). |
|
|
|
|
|
|
M. Radmacher, R. W. Tillmann, M. Fritz, H. E. Gaub: From
Molecules to Cells: Imaging Soft Samples with the Atomic Force Microscope,
Science 257(5078):1900-1905 (1992). |
|
|
|
|
|
|
F. Moreno-Herrero, J. Colchero, J. Gómez-Herrero, A.M. Baró: Atomic
force microscopy contact, tapping, and jumping modes for imaging biological
samples in liquids, Phys. Rev. E 69(3):031915 (2004). |
|
|
|
|
|
|
H. Hertz: Über die Berührung
fester elastischer Körper, Journal für die reine und angewandte
Mathematik 92:156-171 (1881).
PDF |
|
|
|
|
|
|
R. E. Mahaffy, C. K. Shih, F. C. MacKintosh, J. Käs: Scanning
probe-based frequency-dependent microrheology of polymer gels and biological
cells, Phys. Rev. Lett. 85(4):880-883 (2000). PDF |
|
|
|
|
|
|
R. E. Mahaffy, S. Park, E. Gerde, J. Käs, C. K. Shih: Quantitative
analysis of the viscoelastic properties in thin regions of fibroblasts
using AFM, Biophys. J. 86(3):1777-1793 (2004).
PDF |
|
|