Home
Home
Laboratory Record
4 Measurement uncertainty
Systematic and statistical measurement uncertainties
should be noted. In case of single measurements usually a maximum error estimate for the determination of the
measurement uncertainty should be made. In case of a series of measurements that contains values with statistical
deviations following a Gaussian distribution, the confidence interval has to be calculated assuming a confidence
level of 95%. For more information on the estimate of the measurement uncertainty consult the supervisor, this
brief guide (Error Analysis![]() )
as well as the literature, e.g. the book "Physikalisches Praktikum", Hrsg. D. Geschke, B. G. Teubner Stuttgart-Leipzig.
)
as well as the literature, e.g. the book "Physikalisches Praktikum", Hrsg. D. Geschke, B. G. Teubner Stuttgart-Leipzig.
5 Summary (Results and Discussion)
The laboratory record is concluded with a summary
of the results as requested by the experimental tasks. Statement of the results always includes measurement
uncertainties. Numerical values should be rounded to the number of significant digits as indicated by the
measurement uncertainties; the latter should be specified with at most two leading digits. The most important
sources of error should be briefly specified. The discussion should focus on:
 a comparison with known (e.g. tabulated) values
the agreement with theoretical relations
a comparison with alternative measurement techniques
the different influence of systematic and statistical measurement uncertainties
 the uncertainty
of the measurement value as well as a critical examination of further sources of error.
the uncertainty
of the measurement value as well as a critical examination of further sources of error.
Some hints on the preparation of graphical representations:
Graphical representations are of particular importance
for the presentation of measurement values and the determination of physical values. In the preparation of graphs,
independent of the use of millimeter paper or scientific software, the following rules should be observed:
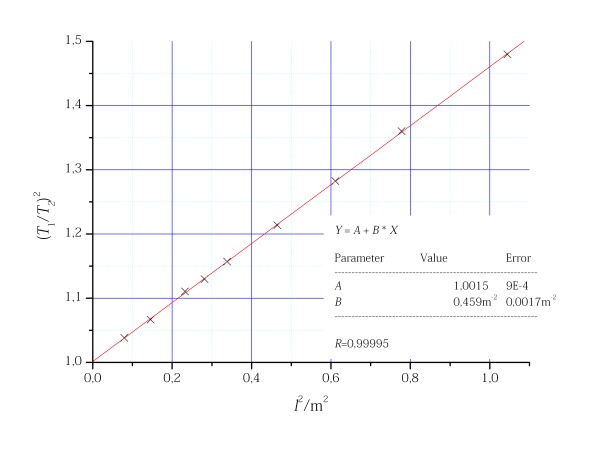
Each graph should have a caption
that clarifies the functional relationship represented.
The scale of the coordinate axes should be chosen in such a way that the angle between the graph
(at least in the range where it is evaluated) and a coordinate axis is about 45°.
The coordinate axes have to be labelled with the physical variables and the corresponding units. The units appear behind the
variable names either separated by a slash (/) or set in round brackets (...).
The measurement values are represented by unique symbols (crosses, open circles, etc.) and should be
clearly discernible besides the theoretical curve (e.g. best-fit line). Measurement uncertainties can be
added as error bars.